Power BI Training: Turn Business Data into Powerful Insights
Data has become one of the most valuable assets for modern organizations. Every business generates data through sales, customers, finance, operations, marketing, employees, and applications.
But raw data alone does not tell the complete story.
Businesses need professionals who can collect, transform, analyze, visualize, and communicate data effectively. This is where Microsoft Power BI plays an important role.
Power BI is Microsoft’s business analytics platform for connecting to data, preparing and modeling it, creating interactive reports and dashboards, and sharing insights across an organization.
Power BI Training helps learners develop these skills step by step—from importing data and cleaning it to building professional dashboards using Power Query, data modeling, DAX, and interactive visualizations.
From Raw Data to Business Decisions: Where Power BI Fits
Imagine a company has thousands of sales records stored across Excel files and SQL Server databases.
Looking at rows and columns may make it difficult to understand:
- Which products are generating the most revenue?
- Which region has the highest sales?
- How are sales changing month by month?
- Which customers contribute the most revenue?
- Are actual sales meeting business targets?
- Which areas require immediate attention?
Power BI can help transform these datasets into interactive reports and visual dashboards, allowing users to filter, explore, and analyze information more effectively.
This makes Power BI useful for Business Intelligence, Data Analytics, Reporting, and decision-support scenarios.
What Makes Power BI an Important Data Analytics Skill?
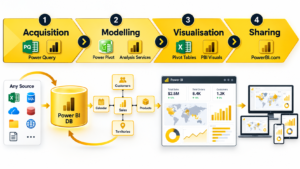
Power BI brings several parts of the analytics process together.
A typical Power BI workflow can involve:
Data Sources → Power Query → Data Model → DAX → Visualizations → Reports → Power BI Service
Microsoft’s current documentation describes this general workflow as connecting and preparing data, modeling and combining data, building reports and dashboards, exploring insights, and sharing content.
The real value comes from understanding how these components work together rather than learning dashboard design alone.
Build Your Power BI Foundation from the Ground Up
A strong Power BI Course should begin with the fundamentals before moving into advanced reporting and analytics.
Learners can understand:
- What is Business Intelligence?
- What is Power BI?
- Power BI Desktop
- Power BI Service
- Reports and dashboards
- Data sources
- Semantic models
- Workspaces
- Visualizations
- Basic Power BI terminology
Power BI Desktop is primarily used for developing reports and data models, while the Power BI service provides cloud-based sharing and collaboration capabilities.
This foundation makes it easier to understand the complete Power BI ecosystem.
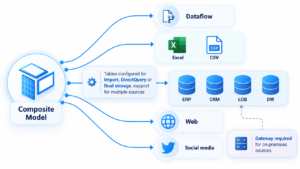
Connect Excel, SQL Server and Other Data Sources
Data rarely exists in a single location in real-world organizations.
A Data Analyst or Power BI Developer may work with:
- Excel
- SQL Server
- CSV files
- Text files
- Azure services
- Cloud databases
- Web sources
- Other supported databases and services
Power BI Desktop supports connections to databases, cloud services, files, web sources, and many other data sources.
Learning how to connect and manage these sources is an essential part of Power BI Training.
Turn Messy Data into Analysis-Ready Data with Power Query
Real-world data is rarely perfect.
It may contain:
- Duplicate records
- Missing values
- Incorrect data types
- Unnecessary columns
- Inconsistent names
- Multiple files
- Unformatted dates
- Incorrect values
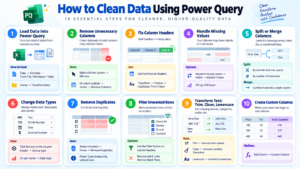
Power Query helps address these data preparation requirements.
Microsoft describes Power Query as a data transformation and preparation engine that provides a graphical interface for connecting to sources and applying repeatable transformations.
During Power Query Training, learners can work with:
- Data cleaning
- Data type conversion
- Filtering
- Sorting
- Removing duplicates
- Splitting columns
- Merging queries
- Appending queries
- Pivoting
- Unpivoting
- Custom columns
- Conditional columns
- Parameters
The important concept is not simply performing a transformation once. Power Query stores transformation steps so the process can be refreshed and reused.
Design a Strong Data Model Before Building Reports
A beautiful dashboard cannot compensate for a poorly designed data model.
Power BI Data Modeling helps organize tables and relationships so that reports can produce meaningful results.
Important concepts include:
- Tables
- Relationships
- Cardinality
- Primary keys
- Foreign keys
- Fact tables
- Dimension tables
- Star schema
- Date tables
- Measures
- Calculated columns
Microsoft provides specific Power BI guidance around relationships, modeling, calculations, and star-schema design.
A good data model can make reporting easier to maintain and improve the reliability of analytical calculations.
Unlock Advanced Analytics with DAX
Once the data model is ready, calculations become an important part of Power BI development.
This is where DAX — Data Analysis Expressions comes into the picture.
DAX is a formula language used to create calculations from data within the model.
A structured Power BI DAX Training can cover:
- Measures
- Calculated columns
- Calculated tables
- Aggregations
- CALCULATE
- FILTER
- SUM
- SUMX
- COUNT
- DISTINCTCOUNT
- IF
- SWITCH
- Date calculations
- Time intelligence
- Filter context
- Row context
For example, instead of simply displaying total sales, DAX can help create calculations for:
Total Sales → Profit → Profit Margin → Year-to-Date Sales → Previous Year Sales → Growth %
This allows reports to move beyond basic charts toward deeper business analysis.
Create Dashboards That Tell a Business Story
A Power BI dashboard should not simply contain a collection of charts.
A useful dashboard should help users answer business questions quickly.
For example:
Sales Dashboard
It may show:
- Total Revenue
- Profit
- Sales Growth
- Top Products
- Top Customers
- Regional Performance
- Monthly Trends
HR Dashboard
It may show:
- Employee Count
- Attrition
- Department Analysis
- Hiring Trends
- Experience
- Employee Distribution
Finance Dashboard
It may show:
- Revenue
- Expenses
- Profit
- Budget vs Actual
- Monthly Performance
- Financial KPIs
Power BI provides interactive visuals that allow users to filter, slice, drill down, and explore information within reports.
Learn Power BI Service for Publishing and Collaboration
Creating a report is only one part of the Power BI journey.
Organizations also need to publish, share, manage, and collaborate on reports.
The Power BI Service provides capabilities such as:
- Workspaces
- Reports
- Dashboards
- Apps
- Sharing
- Scheduled refresh
- Alerts
- Subscriptions
- Security
- Collaboration
Microsoft’s documentation identifies workspaces, reports, dashboards, and semantic models as key concepts within the Power BI service.
This makes Power BI Service Training an important component of an end-to-end Power BI learning path.
Take Your Skills Beyond Dashboards with Real-Time Projects
Theory becomes much more useful when learners apply it to realistic business scenarios.
A practical Power BI Training Course can include projects such as:
Retail Sales Analytics
Analyze:
- Product sales
- Customer behavior
- Regional performance
- Revenue
- Profit
- Sales trends
Banking Analytics
Analyze:
- Customer accounts
- Transactions
- Loans
- Branch performance
- Customer segments
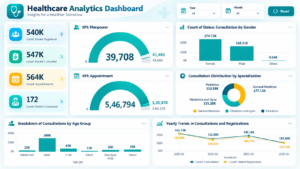
Healthcare Analytics
Analyze:
- Patient information
- Departments
- Treatments
- Revenue
- Hospital performance
E-Commerce Analytics
Analyze:
- Orders
- Customers
- Products
- Revenue
- Returns
- Delivery performance
The objective is to practice the complete workflow:
Raw Data → Data Cleaning → Data Modeling → DAX → Visualization → Dashboard → Business Insights
Power BI + SQL: A Valuable Combination for Data Professionals
Power BI becomes especially useful when combined with SQL.
SQL helps professionals work with databases and retrieve the required data, while Power BI helps transform, model, visualize, and analyze that information.
For example:
SQL Server → SQL Queries → Power BI → Power Query → Data Model → DAX → Dashboard
Professionals with knowledge of both SQL and Power BI can work across different stages of the reporting and analytics process.
This combination can be particularly relevant for learners targeting:
- Data Analyst
- Power BI Developer
- BI Analyst
- Reporting Analyst
- Business Analyst
Who Can Start Learning Power BI?
Power BI Training can be useful for people from different technical backgrounds.
It can be suitable for:
- Freshers
- Working Professionals
- Data Analysts
- Business Analysts
- SQL Developers
- BI Developers
- Reporting Professionals
- Excel Professionals
- Finance Professionals
- Marketing Professionals
- Database Professionals
- Professionals transitioning into Data Analytics
You do not need to master every Power BI feature before getting started.
A step-by-step approach can help you progress from basic reporting to advanced analytics.
Build Skills for Modern Data and BI Roles
Power BI skills can be relevant to several roles in the data and business intelligence ecosystem.
Possible career paths include:
Power BI Developer
Build reports, dashboards, data models, and analytical solutions.
Data Analyst
Analyze datasets and communicate business insights through reports and dashboards.
BI Analyst
Work with business data, KPIs, reporting requirements, and analytical solutions.
Reporting Analyst
Develop and maintain reports used by business teams.
Business Analyst
Translate business requirements into analytical and reporting solutions.
BI Consultant
Help organizations design and implement business intelligence solutions.
The actual responsibilities vary according to the organization, project, and job role.
Why Choose Practical Power BI Training?
Learning Power BI only through videos or theory may not provide enough exposure to real business scenarios.
A practical approach can help learners understand:
- How business requirements become reports
- How raw data is prepared
- How tables are related
- Why a particular DAX calculation is required
- How dashboards are designed
- How reports are published
- How users interact with reports
- How to troubleshoot common reporting issues
SQL School’s Power BI training page currently highlights real-time projects, dashboard design, DAX, data modeling, and hands-on tools training as part of its BI programs.
For your website positioning, the training can be presented around 100% Practical Learning, Step-by-Step Training, Real-Time Projects, Scenario-Based Training, Interview Preparation, Resume Guidance, and 100% Placement Assistance.
Frequently Asked Questions About Power BI Training
What is Power BI?
Power BI is Microsoft’s business analytics platform for connecting, transforming, modeling, visualizing, analyzing, and sharing data.
Is Power BI difficult for beginners?
Power BI can be learned progressively. Beginners can start with basic data connections and visualization before moving into Power Query, data modeling, and DAX.
What is Power Query used for?
Power Query is used for connecting to data sources and transforming and preparing data before analysis.
What is DAX?
DAX, or Data Analysis Expressions, is a formula language used to create calculations and analytical expressions in Power BI models.
Is SQL required for Power BI?
SQL is not mandatory to start learning Power BI. However, SQL knowledge is highly useful when working with relational databases and enterprise reporting environments.
Conclusion
Power BI is not just about creating attractive charts.
It is about understanding data, asking the right business questions, preparing reliable datasets, building effective models, creating meaningful calculations, and presenting insights in a way that people can understand.
A strong learning path can take you through:
SQL → Power Query → Data Modeling → DAX → Visualization → Power BI Service → Real-Time Projects
If you are planning to build skills in Data Analytics, Business Intelligence, Reporting, or Power BI Development, structured Power BI Training can give you a practical foundation for your learning journey.
Power BI Training: https://sqlschool.com/power-bi-courses/
Start Learning Power BI with SQL School
Learn Power BI. Work with Real-Time Data. Build Interactive Dashboards. Develop Practical Data Analytics Skills.
SQL School Training Institute – Hyderabad
Power BI Training | Real-Time Projects | Practical Learning | Interview Preparation | 100% Placement Assistance
📞 +91 9666440801 | +91 9951440801
#PowerBI #PowerBITraining #PowerBICourse #LearnPowerBI #PowerBITrainingInHyderabad #PowerBICourseInHyderabad #PowerBIDeveloper #PowerBIDataAnalyst #PowerBIAnalytics #PowerBIDashboard #PowerBIDAX #PowerQuery #DataAnalytics #DataAnalyst #BusinessIntelligence #BI #DataVisualization #MicrosoftPowerBI #SQL #DataModeling #RealTimeProjects