
Power BI Data Modeling: Complete Guide with Star Schema, Relationships & Best Practices
Introduction
Power BI Data Modeling is one of the most important skills for anyone working as a Data Analyst, Power BI Developer, BI Developer, or Business Intelligence professional.
Building a dashboard is not just about creating attractive charts. Behind every fast, accurate, and scalable Power BI report is a well-designed data model.
A poor data model can result in slow reports, incorrect calculations, complicated DAX formulas, and difficult maintenance. A properly designed Power BI data model makes reporting faster, simpler, and more reliable.
In this guide, we will understand Power BI Data Modeling, including tables, relationships, fact and dimension tables, Star Schema, Snowflake Schema, cardinality, filter direction, best practices, and practical examples.
What Is Data Modeling in Power BI?
Data Modeling in Power BI is the process of organizing multiple tables and defining relationships between them so that Power BI can efficiently analyze and visualize business data.
In simple terms, a data model tells Power BI what data is available, how different tables are connected, which tables contain business transactions, which tables describe those transactions, how filters should move between tables, and how calculations should behave.
Why Is Data Modeling Important in Power BI?
A good data model improves report performance, makes DAX calculations easier, supports accurate business insights, simplifies maintenance, and provides better scalability as data volumes and reporting requirements grow.
Core Components of a Power BI Data Model
The two most important table types are Fact Tables and Dimension Tables.
Fact Tables contain measurable business transactions or events such as sales, orders, payments, inventory movements, website visits, or insurance claims. They normally contain foreign keys and numeric measures.
Dimension Tables contain descriptive information used to categorize, group, and filter facts. Common examples include DimProduct, DimCustomer, DimDate, DimStore, DimEmployee, and DimGeography.
If a Fact table tells us what happened, Dimension tables help explain who, what, where, and when.
Fact Table vs Dimension Table
Fact Table:
• Stores transactions and measurable events
• Usually contains many rows
• Contains foreign keys
• Used for aggregation
• Examples: Sales, Orders, Payments
Dimension Table:
• Stores descriptive attributes
• Usually contains fewer rows
• Contains a unique key
• Used for filtering and grouping
• Examples: Customer, Product, Date, Store
What Is Star Schema in Power BI?
The Star Schema is a recommended modeling approach for many analytical Power BI solutions. In a Star Schema, a central Fact table is connected directly to multiple Dimension tables.
For example, FactSales can be connected to DimDate, DimProduct, DimCustomer, and DimStore. The Fact table sits in the center and the surrounding Dimension tables form a star-like structure.
This design is simple to understand, supports efficient filtering, and usually makes DAX and report development easier.
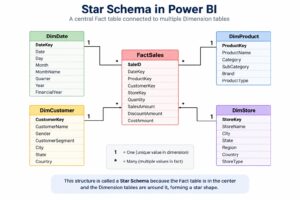
Example of a Power BI Star Schema
FactSales may contain SaleKey, DateKey, ProductKey, CustomerKey, StoreKey, Quantity, SalesAmount, and CostAmount.
DimProduct may contain ProductKey, ProductName, Category, SubCategory, and Brand.
DimCustomer may contain CustomerKey, CustomerName, CustomerSegment, City, State, and Country.
DimDate may contain DateKey, Date, Day, Month, MonthName, Quarter, and Year.
DimStore may contain StoreKey, StoreName, City, State, Region, and Country.
Typical relationships are:
DimProduct (1) → (*) FactSales
DimCustomer (1) → (*) FactSales
DimDate (1) → (*) FactSales
DimStore (1) → (*) FactSales
What Is Snowflake Schema?
A Snowflake Schema is a modeling approach where dimensions may be normalized into additional related tables. For example, Product, SubCategory, and Category information may be stored in separate related tables.
Compared with a Star Schema, a Snowflake Schema can introduce more tables and relationships. For many Power BI analytical models, Star Schema is a strong default because it is simpler for report authors and users to understand.
Understanding Relationships in Power BI
Relationships connect tables based on matching columns. For example, DimProduct[ProductKey] can be related to FactSales[ProductKey].
ProductKey should normally be unique on the Dimension side, while the same ProductKey can occur many times in FactSales. This creates a One-to-Many relationship.
Cardinality in Power BI
Cardinality defines how rows in one table relate to rows in another.
One-to-Many (1:*): One row in a Dimension table can relate to many rows in a Fact table. This is the most common relationship in a Star Schema.
Many-to-One (*:1): The same relationship viewed from the opposite direction.
One-to-One (1:1): Each row in one table corresponds to one row in another table.
Many-to-Many (*:*): Multiple rows in both tables can relate to multiple rows in the other table. Use this carefully because it can make filtering and calculations more complex.
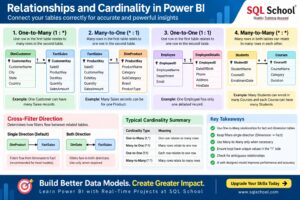
Cross-Filter Direction in Power BI
Cross-filter direction controls how filters propagate between related tables. The common options are Single and Both.
In a typical Star Schema, filters normally flow from the Dimension table toward the Fact table. For example, selecting a Product Category filters DimProduct and then the related rows in FactSales.
Avoid using bidirectional filtering everywhere. Use it only when the model genuinely requires it, because unnecessary bidirectional relationships can introduce ambiguous filter paths and unexpected results.
Active and Inactive Relationships
Power BI can contain multiple relationships between tables, but only the appropriate relationship is active for normal filter propagation.
For example, a Sales table may contain OrderDate, ShipDate, and DeliveryDate. DimDate may have relationships to all three. The OrderDate relationship may be active while ShipDate is inactive.
DAX can use USERELATIONSHIP() inside CALCULATE() when a measure needs to use an inactive relationship.
Importance of a Date Table
Most business reports require time-based analysis such as monthly sales, quarterly revenue, Year-over-Year growth, Month-over-Month growth, YTD Sales, and Previous Year Sales.
A dedicated Date Dimension keeps time analysis organized and supports consistent reporting across the model.
Example DAX Measures
Total Sales = SUM(FactSales[SalesAmount])
Total Quantity = SUM(FactSales[Quantity])
Total Orders = DISTINCTCOUNT(FactSales[OrderID])
Average Order Value = DIVIDE([Total Sales], [Total Orders])
With a clean data model, these measures respond naturally to Product, Customer, Date, Store, Geography, and other Dimension filters.
Power BI Data Modeling Best Practices
- Use Star Schema where appropriate.
• Separate transactional data from descriptive dimensions.
• Use meaningful names such as FactSales, DimCustomer, DimProduct, and DimDate.
• Avoid unnecessary many-to-many relationships.
• Prefer simple, single-direction filter paths.
• Remove columns that are not needed for reporting, calculations, relationships, or business logic.
• Prefer measures for dynamic business calculations.
• Hide technical key columns from report consumers when appropriate.
• Use consistent naming conventions.
• Create a dedicated measures table or organized measure structure when useful.
• Build and maintain a proper Date Dimension.
• Test relationships and totals before publishing reports.
Common Power BI Data Modeling Mistakes
Common mistakes include loading everything into one giant table, creating relationships without understanding cardinality, using bidirectional filtering everywhere, ignoring Star Schema principles, creating unnecessary calculated columns, failing to build a proper Date table, and keeping columns that are never used.
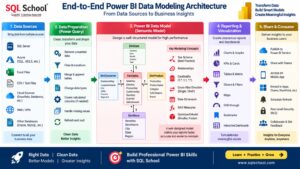
End-to-End Power BI Data Modeling Architecture
A typical Power BI solution follows this flow:
Data Sources
SQL Server, Azure, Excel, CSV, Snowflake, Databricks, APIs and other databases
→ Data Preparation with Power Query
Clean, transform, filter, merge, append, change data types, handle missing values and load data
→ Power BI Semantic Model
Fact Tables + Dimension Tables + Star Schema + Relationships + Cardinality + Filter Direction + Date Dimension + DAX Measures
→ Reporting & Visualization
Charts, KPIs, Cards, Tables, Matrix visuals, Slicers, Maps and Drill-through
→ Share & Consume
Power BI Service, Teams, mobile access, embedded reports, scheduled refresh and Row-Level Security
A well-designed model helps make reports faster, more accurate, easier to maintain, and easier for business users to understand.
Power BI Data Modeling Interview Questions
- What is Data Modeling in Power BI?
2. What is a Fact Table?
3. What is a Dimension Table?
4. What is Star Schema?
5. What is Snowflake Schema?
6. What is the difference between Star Schema and Snowflake Schema?
7. What is cardinality in Power BI?
8. Explain a one-to-many relationship.
9. What is a many-to-many relationship?
10. What is cross-filter direction?
11. What is the difference between Single and Both filter directions?
12. What are active and inactive relationships?
13. What does USERELATIONSHIP() do?
14. Why should we create a Date Dimension?
15. What are the best practices for Power BI Data Modeling?
16. Why should unnecessary columns be removed?
17. What problems can bidirectional relationships cause?
18. How would you design a Sales data model?
19. How do relationships affect DAX calculations?
20. How would you optimize a large Power BI semantic model?
Power BI Data Modeling Learning Roadmap
Step 1: Understand relational database concepts
Step 2: Learn Fact and Dimension tables
Step 3: Understand Star Schema
Step 4: Learn Power Query transformations
Step 5: Understand relationships and cardinality
Step 6: Learn filter direction and filter propagation
Step 7: Build a proper Date Dimension
Step 8: Learn DAX fundamentals
Step 9: Understand filter context
Step 10: Practice with real-world Power BI projects
Conclusion
Power BI Data Modeling is the backbone of professional Power BI development.
Creating visuals may be the most visible part of a Power BI project, but the quality of the underlying data model determines how accurate, maintainable, and performant the final solution will be.
A strong Power BI developer should understand Fact Tables, Dimension Tables, Star Schema, Relationships, Cardinality, Filter Direction, Date Dimensions, DAX, and performance optimization.
Instead of focusing only on dashboards, spend time mastering the model behind them.
SQL School – Call to Action
Want to become job-ready in Power BI?
SQL School Power BI training focuses on practical concepts, real-time scenarios, Data Modeling, Power Query, DAX, dashboard development, interview preparation, and project-based learning.
Website: www.sqlschool.com
Call / WhatsApp: +91 99514 40801
#PowerBI #PowerBIDataModeling #PowerBIDeveloper #PowerBITraining #PowerBIAnalytics #DataModeling #StarSchema #SnowflakeSchema #PowerBIRelationships #DAX #PowerQuery #BusinessIntelligence #DataAnalytics #DataAnalyst #BIDeveloper #DataVisualization #PowerBITips #PowerBIInterviewQuestions #MicrosoftPowerBI #SQLSchool