
Data Analyst Course: Turn Raw Data into Real Business Insights
Data is one of the most valuable resources for modern businesses. Every day, organizations generate enormous amounts of information through sales, customers, websites, applications, finance, marketing, and business operations.
But raw data alone is not enough.
Businesses need skilled professionals who can understand data, identify patterns, discover trends, and convert numbers into meaningful insights.
This is where a Data Analyst plays an important role.
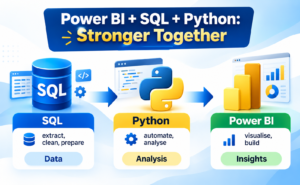
A practical Data Analyst Course helps learners develop the skills required to work with data using technologies such as SQL, Microsoft Excel, Python, Power BI, data visualization, and business analytics.
Whether you are a fresher, working professional, IT employee, or someone planning a career transition, learning Data Analytics can provide a strong foundation for entering the data-driven technology industry.
What Does a Data Analyst Actually Do?
A Data Analyst works with data to answer business questions and support informed decision-making.
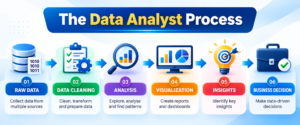
The role usually involves several stages:
Collect → Clean → Transform → Analyze → Visualize → Interpret → Report
For example, imagine an organization wants to understand why its sales have decreased.
A Data Analyst may:
- Retrieve sales information using SQL
- Clean and organize the data using Excel or Python
- Analyze sales patterns
- Compare products and regions
- Create Power BI dashboards
- Identify important trends
- Present findings to business teams
The objective is not simply to work with numbers.
The real objective is to turn data into understandable and useful business information.
Why Are Data Analytics Skills So Important?
Modern organizations make decisions based on data across areas such as:
- Sales
- Marketing
- Finance
- Healthcare
- Banking
- E-commerce
- Human Resources
- Manufacturing
- Telecommunications
- Technology
A Data Analyst can help organizations understand what is happening, identify patterns, monitor performance, and find opportunities for improvement.
This makes Data Analytics training valuable for professionals who want to develop both technical and analytical skills.
The Core Skills Behind a Successful Data Analyst
A strong Data Analyst does not depend on one tool.
Instead, different technologies are used at different stages of the analytical process.
SQL – Extract the Right Data
SQL is one of the most important technical skills for Data Analysts.
Organizations commonly store business information inside databases, and SQL allows analysts to retrieve and analyze that information.
A Data Analyst can use SQL to find:
- Monthly sales
- Top customers
- Best-performing products
- Regional revenue
- Customer transactions
- Employee information
- Business KPIs
Important SQL concepts include:
- SELECT statements
- Filtering
- Sorting
- Aggregate functions
- GROUP BY
- HAVING
- Joins
- Subqueries
- CTEs
- CASE statements
- Window functions
- Views
- Stored procedures
SQL gives a Data Analyst the ability to ask questions directly from business data.
Excel – Analyze Data Quickly
Microsoft Excel remains an important tool for business analysis and reporting.
A Data Analyst can use Excel for:
- Data cleaning
- Calculations
- Lookup operations
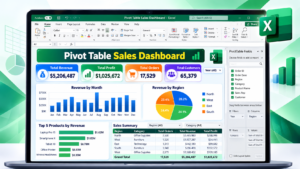
- Pivot Tables
- Pivot Charts
- Conditional formatting
- Data validation
- Reporting
- Quick analysis
- Dashboard preparation
- Power Query
Advanced Excel skills can be particularly useful when working with business teams that already depend heavily on spreadsheets.
Python – Work Smarter with Data
Python is another valuable skill for modern Data Analysts.
It can help automate repetitive tasks, clean datasets, perform exploratory analysis, and work with large amounts of structured information.
A Python for Data Analytics learning path can include:
- Python fundamentals
- Variables and data types
- Lists and dictionaries
- Conditions
- Loops
- Functions
- File handling
- NumPy
- Pandas
- Data cleaning
- Data transformation
- Exploratory Data Analysis
- Data visualization
Python can be especially useful when the analysis becomes too complex or repetitive to handle efficiently with spreadsheets alone.
Power BI – Transform Analysis into Interactive Dashboards
Analyzing data is only one part of the job.
The next challenge is communicating the results clearly.
Power BI can help Data Analysts transform data into interactive dashboards and reports.
Important Power BI concepts include:
- Data import
- Power Query
- Data transformation
- Data modeling
- Relationships
- DAX
- Measures
- Calculated columns
- KPIs
- Charts
- Filters
- Slicers
- Interactive reports
- Dashboard development
A well-designed dashboard allows managers and business teams to quickly understand important performance indicators.
From Messy Data to Meaningful Information
Real-world data is rarely perfect.
A dataset may contain:
- Missing values
- Duplicate records
- Incorrect formats
- Inconsistent names
- Invalid values
- Outliers
- Unnecessary columns
Before analysis begins, these problems need to be identified and addressed.
Data cleaning can be performed using SQL, Excel, Python, and Power Query.
This is an important part of Data Analyst training because the quality of the analysis depends heavily on the quality of the underlying data.
Data Visualization: Make Numbers Easy to Understand
Imagine looking at a spreadsheet containing thousands of rows.
Finding an important trend can be difficult.
Now imagine seeing that same information through an interactive dashboard.
The difference is data visualization.
Data Analysts may use:
- Bar charts
- Line charts
- Pie charts
- Scatter plots
- Tables
- KPI cards
- Maps
- Interactive dashboards
Good visualization makes complex information easier to understand and communicate.
The purpose is not simply to create attractive charts.
It is to make important information clear, meaningful, and actionable.
Business Questions Come Before Data Analysis
One of the most important skills for a Data Analyst is understanding the business problem.
For example:
Question: Why did sales decrease last quarter?
Instead of immediately creating a chart, the analyst may investigate:
- Which products declined?
- Which regions were affected?
- Which customer segments changed?
- Did the decline happen during a specific month?
- Did pricing change?
- Did customer orders decrease?
- Which sales channels were affected?
The analyst then uses SQL, Excel, Python, and Power BI to investigate the problem.
This combination of technical knowledge + analytical thinking + business understanding makes Data Analytics more effective.
Who Can Start Learning Data Analytics?
A Data Analyst Course can be suitable for a wide range of learners, including:
- Fresh graduates
- IT professionals
- Working professionals
- Software developers
- SQL professionals
- Excel professionals
- Business professionals
- MIS professionals
- Career switchers
- Beginners interested in Data Analytics
You do not need to master everything on day one.
A structured learning approach can help you progress from fundamentals to practical analytics.
Data Analyst Career Opportunities
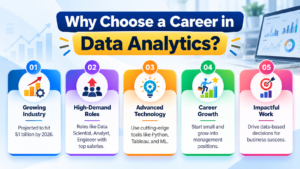
After developing relevant technical and analytical skills, learners can explore roles such as:
- Data Analyst
- Junior Data Analyst
- Business Data Analyst
- Reporting Analyst
- BI Analyst
- MIS Analyst
- Power BI Analyst
- SQL Data Analyst
- Data Visualization Analyst
- Business Intelligence Developer
Career progression can vary based on experience, skills, industry, location, and job requirements.
Data Analyst Skills That Employers Look For
A strong Data Analyst skill set can include:
Technical Skills
- SQL
- Excel
- Python
- Power BI
- Data Cleaning
- Data Visualization
- Data Modeling
- DAX
- Reporting
Analytical Skills
- Problem-solving
- Logical thinking
- Pattern identification
- Critical thinking
- Business understanding
Professional Skills
- Communication
- Presentation
- Documentation
- Requirement understanding
- Storytelling with data
The combination of these skills can help professionals approach real-world analytical problems more effectively.
Why Choose SQL School for Data Analyst Training?
SQL School Training Institute – Hyderabad provides a practical learning approach designed around technical concepts, real-time scenarios, and hands-on projects.
The Data Analyst learning journey can include:
- Microsoft SQL & T-SQL
- Advanced Excel
- Power BI
- Python for Analytics
- Real-Time Projects
- Scenario-Based Training
- Data Visualization
- Interview Preparation
- Resume Guidance
- 100% Placement Assistance
The focus is on helping learners understand concepts step-by-step and apply them to practical business scenarios.
Frequently Asked Questions About Data Analyst Course
1. What is a Data Analyst Course?
A Data Analyst Course teaches you how to collect, clean, analyze, visualize, and interpret data using tools such as SQL, Excel, Python, and Power BI.
2. Who can join a Data Analyst Course?
Freshers, graduates, working professionals, IT professionals, non-IT professionals, Excel users, SQL professionals, and career switchers can learn Data Analytics.
3. Is a Data Analyst Course suitable for beginners?
Yes. Beginners can start with the fundamentals of Excel and SQL and gradually learn Python, Power BI, data visualization, and advanced analytics concepts.
4. What skills are required to become a Data Analyst?
Important skills include SQL, Excel, Python, Power BI, data cleaning, data visualization, analytical thinking, problem-solving, and business understanding.
5. Why is SQL important for Data Analysts?
SQL helps Data Analysts retrieve, filter, join, aggregate, and analyze information stored in databases. It is an important skill for working with business data.
Conclusion
Data Analytics is an exciting field that combines SQL, Excel, Python, Power BI, data visualization, and business understanding to transform raw data into meaningful insights. A practical Data Analyst Course can help learners build these skills through hands-on exercises, real-time projects, and scenario-based learning.
Whether you are a fresher, working professional, or career switcher, developing strong Data Analytics skills can help you explore opportunities across different industries. Start your learning journey today, strengthen your technical and analytical abilities, and take the next step toward a career in the data-driven world.
Data Analyst Training: https://sqlschool.com/powerbi-data-analyst-training/
Start Your Data Analyst Training with SQL School
Trainer: Mr. Sai Phanindra – Founder & Trainer
Experience: 20+ Years Expertise
Training: 100% Practical | Step-by-Step Learning | Real-Time Projects | Scenario-Based Training
Placement: 100% Placement Assistance
📞 Call: +91 9666440801 | +91 9951440801
🌐 Website: sqlschool.com
Book your FREE Demo Session and start building your Data Analyst skills today!
#DataAnalyst #DataAnalytics #DataAnalystCourse #DataAnalystTraining #DataAnalyticsCourse #DataAnalyticsTraining #SQL #SQLServer #Excel #AdvancedExcel #Python #PythonForDataAnalytics #PowerBI #DataVisualization #BusinessAnalytics #BusinessIntelligence #DataScience #DataAnalystCareer #DataAnalystJobs #DataAnalyticsSkills #RealTimeProjects #DataDriven #CareerInDataAnalytics #TechSkills #ITTraining #CareerGrowth #JobReadySkills #DataAnalyticsHyderabad #SQLSchool