
Power BI Desktop: An End-to-End guide
While data is all around, raw numbers are not enough to make decision, visuals are. That’s where the Microsoft flagship BI tool comes into the picture. Anyone who has ever asked “what is Power BI Desktop?” knows that it is one of the most sought-after skills among data analysts, BI developers and business users in 2026. In this blog, we are going to go through every aspect of the tool, from basic installation to building a more complex report, so that you don’t just hear about the tool, but also know how it works from start to finish.
Power BI Desktop” is what?
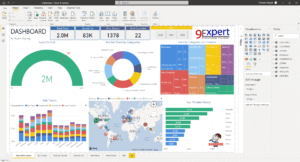
So, what is Power BI Desktop? A Microsoft free application, designed for use with Windows, to access data sources, data transform, data modeling, and create interactive reports/dashboards. The Power BI Desktop is the authoring tool (as opposed to the cloud service, Power BI Service), where all the actual report creation work takes place before the report is published to the cloud.
Here are some of the features of Power BI Desktop:
- Available for download and use for individual reports, free of charge!
- Integrates with 100+ data sources that include SQL Server, Excel, Azure, SharePoint, Snowflake, and more
- Data cleaning and transformation using Power Query Editor
- Applies DAX (Data Analysis Expressions) to perform calculations and measures
- Uses drag and drop visualizations without coding for simple reports
Why Learn Power BI Desktop in 2026?
All businesses today are data-driven and organizations need people who can convert spreadsheets into decisions. Learning Power BI Desktop opens the door on roles – Data Analyst, Business Analyst, BI Developer and even Data Engineer are increasingly finding it in their job postings. It complements SQL, Excel and Azure naturally, and is a great addition to any data professional’s toolbox, not a skill in and of itself.
Install Power BI Desktop and set up the application.Install and set up Power BI Desktop.
It’s easy to get started:
- Install Power BI Desktop from the Microsoft Store or Power BI website.Install Power BI Desktop from Microsoft Store or Power BI website.
- Download it — you don’t need to pay for or enter a license key in the desktop version
- Sign up using work or school email (optional, but required to publish reports later)
- When the app is launched, the three main views are seen: Report View, Data View, and Model View.
After installation, you can import data from any data sources your organization is using.
The End-to-End Power BI Desktop Workflow
Many learners will get stuck here, as Power BI Desktop is not simply “drag a chart and done. It has a well-defined pipeline:
Connect to Data
You can use the Get Data feature in Power BI Desktop to access data from Excel files, SQL server databases, web APIs, Azure Data Lake, SharePoint lists and dozens of other connectors.
Transform Data with Power Query.
Data is nearly always to be cleaned prior to analysis. You can use the Power Query Editor to:
- Eliminate any duplications and empty lines
- Divide or combine columns
- Change data types
- Join and concatenate several tables
- Use transformations with M-language for more complex logic
The Data Model is created.The Data Model is built.
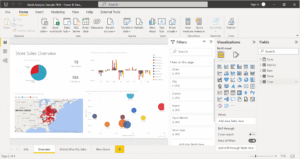
This step is to define the relationship between your tables. In Model View, relationships (one-to-many, many-to-many) are constructed between Fact and Dimension tables, which is very similar to creating a mini star schema within Power BI Desktop.
Write DAX Measures
DAX is the formula language for calculations such as YTD sales, running totals, and percentages. A simple measure is something that looks like this:
Total Sales = SUM(Sales[SalesAmount])
There are more advanced measures which utilize functions such as CALCULATE, FILTER and time intelligence functions such as SAMEPERIODLASTYEAR.
Create Reports and Graphics
To create bar charts, line charts, maps, KPI cards and slicers, drag fields to the canvas in Report View. Dashboards are truly interactive and not just pictures, due to formatting, tooltips, drill-throughs and bookmarks.
Share the report on Power BI Service
After your report is complete, it’s published in the Power BI Service, and you can share it with teams, schedule it for update, and access it on mobile devices.
What Makes Power BI Desktop Powerful
- Custom visuals marketplace — Import chart types in addition to the library ones.
- Accept Q&A natural language queries — ask questions in natural language and get a visual reply
Use row level security (RLS) to control what data individual users can access, based on a role. - Bookmarks and drill through: create guided, story driven dashboards
- Direct Query vs Import Mode — Select between live connection and imported datasets based on the number of data points.Direct Query vs Import Mode — Select between live connection and imported datasets based on data points.
Power BI Desktop vs Power BI Service: A Quick Clarification
A common beginner question is how these two differ:
| Power BI Desktop | Power BI Service |
|---|---|
| Windows app, used for building reports | Cloud platform, used for sharing and collaboration |
| Free | Free tier + paid Pro/Premium licenses for sharing |
| Data modeling and DAX authoring happens here | Scheduled refresh, dashboards, and app distribution happen here |
It is crucial to know the difference between these because in job descriptions you may see both mentioned – in interviews or real projects.
After completing the course, students can pursue a number of career paths such as:
- Power BI Developer — Enterprise level Reports and Data Models development
- Business Analyst, leveraging dashboard for decision making.
- Data Analyst — SQL, Excel, Power BI for complete analytics workflows.
- Working on several client environments, designing solutions as a BI Consultant.
Many of these positions also require experience with working with SQL, as Power BI Desktop is seldom used alone and is typically working on top of a structured database.
Final Thoughts
We’ve reached the point where it should be obvious what Power BI Desktop is: It’s not just a charting tool, it’s a full data modeling & visualization environment that transforms messy data into actionable decisions. Learning how to work with Power BI Desktop end-to-end, from Power Query to DAX to publishing reports is one of the best investments you can make in your data career this year, whether you are new to BI tools or an established professional looking to upskill.
For hands-on and structured learning of Power BI Desktop from basics to advanced DAX and real-time dashboards, check out the Power BI course at SQL School.