How to Design a Basic Power BI Report Explained Step by Step
INTRODUCTION:-
Power BI is one of the most popular business intelligence tools used to convert raw data into meaningful dashboards and reports. A well-designed Power BI report helps users understand data quickly, identify trends, and make better decisions
In this blog, we will learn how to design a basic Power BI report step by step.
YouTube link:- https://www.youtube.com/watch?v=rsXEiYZIj20
What is a Power BI Report?
A Power BI report is a collection of visuals such as charts, tables, cards, slicers, and graphs created using data from different sources. These reports allow users to analyze business data in an interactive way
Step 1: Open Power BI Desktop
First, open Power BI Desktop on your system. Power BI Desktop is the main tool used to create reports and dashboards.
After opening Power BI Desktop, you will see options to import data, transform data, create visuals, and publish reports.
Step 2: Import Data into Power BI
To create a report, you need data. Power BI supports many data sources such as:
- Excel files
- SQL Server
- CSV files
- SharePoint
- Web data
- Databases
Click on Get Data, choose your data source, and load the data into Power BI.
Step 3: Clean and Transform Data
Before creating visuals, the data should be cleaned properly. Power BI provides Power Query Editor to clean and transform data.
Common data cleaning tasks include:
- Removing unnecessary columns
- Renaming columns
- Changing data types
- Removing duplicate records
- Filtering unwanted rows
- Creating calculated columns
Clean data helps in creating accurate reports.
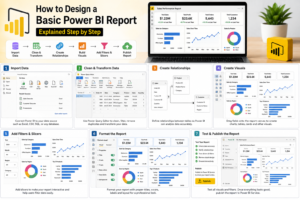
Step 4: Create Relationships between Tables
If your report uses multiple tables, you need to create relationships between them.
For example, a Sales table can be connected with a Customer table using Customer ID.
Relationships help Power BI understand how tables are connected and allow correct analysis across multiple datasets.
Step 5: Create Basic Visuals
After loading and preparing data, start creating visuals.
Some commonly used Power BI visuals are:
Card: To show single values like total sales or total customers
- Bar Chart: To compare values by category
- Line Chart: To show trends over time
- Pie Chart: To show percentage distribution
- Table: To display detailed data
- Slicer: To filter report data interactively
Drag fields from the data pane and drop them into the report canvas to create visuals.
Step 6: Add Important KPIs
KPIs help users understand business performance quickly.
Examples of basic KPIs include:
- Total Sales
- Total Profit
- Total Quantity
- Total Customers
- Average Sales
- Monthly Revenue
You can display KPIs using card visuals.
Step 7: Apply Filters and Slicers
Slicers make the report interactive. Users can filter data by selecting values.
Common slicers include:
- Year
- Month
- Region
- Category
- Product
Customer Slicers improve report usability and allow users to analyse specific data easily.
Step 8: Format the Report Design
Report design is very important. A clean layout makes the report easy to understand.
Follow these design tips:
- Use a simple background
- Keep proper spacing between visuals
- Use clear chart titles
- Use consistent colours
- Align visuals properly
- Avoid too many visuals on one page
- Highlight important numbers
Step 9: Add Report Title and Labels
Every report should have a clear title. The title helps users understand the purpose of the report.
Sales Performance Report
Also, add proper labels and headings for each section. This makes the report more readable
Step 10: Test the Report
Before publishing the report, test all visuals and filters.
Check:
- Are values correct?
- Are relationships working?
- Are slicers filtering properly?
- Are visuals easy to understand?
- Is the report layout clean?
Testing helps avoid errors before sharing the report with users.
Step 11: Publish the Report
Once the report is ready, you can publish it to Power BI Service.
Click on Publish, sign in to your Power BI account, and select the workspace where you want to publish the report.
After publishing, users can access the report online.
Best Practices for Basic Power BI Report Design
To create a good Power BI report, follow these best practices:
- Keep the report simple and clean
- Show important KPIs at the top
- Use meaningful chart titles
- Avoid unnecessary visuals
- Use slicers for better filtering
- Maintain consistent formatting
- Use proper data relationships
- Validate data before publishing
Key Takeaways
Power BI reports help convert raw data into useful insights. To design a basic Power BI report, you need to import data, clean it, create relationships, build visuals, apply filters, format the design, and publish the report.
A good Power BI report should be simple, interactive, accurate, and easy to understand.
Frequently Asked Questions
What is Power BI used for
Power BI is used for data analysis, report creation, dashboard design, and business intelligence.
Can beginners learn Power BI?
Yes, beginners can learn Power BI easily by starting with basic reports, visuals, and data cleaning.
What is the difference between a report and a dashboard in Power BI?
A report contains multiple pages with detailed visuals, while a dashboard is usually a single-page summary created in Power BI Service.
Do we need coding to create Power BI reports?
Basic Power BI reports do not require coding. However, DAX formulas can be used for advanced calculations.
Which visual is best for showing total sales?
A card visual is best for showing total sales as a single KPI value.
Conclusion
Designing a basic Power BI report is simple when you follow the correct step-by-step process. Start by importing data, cleaning it, creating relationships, adding visuals, applying slicers, and formatting the report properly.
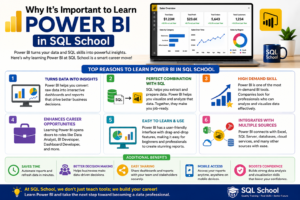
Why Choose SQL School?
Choosing the right training institute is the first step toward a successful IT career. At SQL School, we are committed to providing industry-focused training that helps students and professionals gain practical skills, earn certifications, and secure rewarding career opportunities.
Expert Trainers
Teach from experienced industry professionals who bring real-world knowledge and practical expertise into every training session.
Industry-Oriented Curriculum
Our courses are designed according to current industry requirements, ensuring that students learn the latest tools, technologies, and best practices.
Hands-On Practical Training
We focus on practical learning through real-time projects, case studies, assignments, and lab sessions to build confidence and technical expertise.
Interview Preparation
We provide mock interviews, resume-building assistance, aptitude training, and interview guidance to help students succeed in job interviews.
Build Your Future with SQL School
Whether you are a student, fresher, working professional, or career changer, SQL School provides the knowledge, practical experience, and career support needed to achieve your goals in the IT industry. Join SQL School today and take the next step toward a successful and rewarding career.
PowerBI #DataAnalytics #BusinessIntelligence #DataAnalyst #PowerBIDeveloper #MicrosoftPowerBI #CareerGrowth #DataVisualization #SQL #LearnPowerBI #AnalyticsCareer #TechSkills #BusinessAnalyst #DashboardDevelopment #SQLSchool
Full Course details:- https://sqlschool.com/powerbi-data-analyst-training/
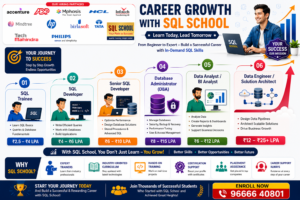
Trainer: Mr. Sai Phanindra
With 20+ Years

📲 Follow us daily for more updates!
🎁 WhatsApp Channel: https://whatsapp.com/channel/0029VamSJLI35fLmVEvCPD3r
🎁 WhatsApp Job Updates : https://whatsapp.com/channel/0029Vb2LI8zG3R3dWqv5jS1T
🎁 Instagram : https://www.instagram.com/sqlschool__training
🎁 YouTube : www.youtube.com/sequelschool
🔥 Trainer Profile : www.linkedin.com/in/saiphanindra
🌐 Website : www.sqlschool.com
📞 Reach Us: +919951440801 | +919666440801