Power BI Course – Complete Guide to Learning Power BI for Data Analytics and Business Intelligence
In today’s data-driven world, organizations rely on analytics to make smarter business decisions. Businesses generate massive amounts of data every day, and transforming this data into meaningful insights is essential for growth and success.
This is where Power BI comes in.
Power BI is a leading Business Intelligence (BI) and Data Visualization tool developed by Microsoft. It enables users to connect, transform, analyze, and visualize data through interactive dashboards and reports.
Whether you are a beginner, Data Analyst, Business Analyst, Data Engineer, Manager, or IT professional, learning Power BI can significantly boost your career opportunities.
What is Power BI?
Power BI is a Business Intelligence and Data Visualization platform developed by Microsoft that helps organizations convert complex data into interactive reports and dashboards.
Instead of manually analyzing spreadsheets and databases, Power BI enables users to:
- Connect to multiple data sources
- Clean and transform data
- Build data models
- Create interactive dashboards
- Generate automated reports
- Share insights across teams
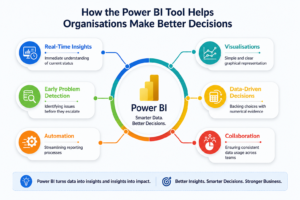
Power BI helps decision-makers understand business performance through visual storytelling and real-time analytics.
Why Power BI Has Become an Industry Standard
Modern businesses generate data from:
- ERP Systems
- CRM Applications
- Websites
- Mobile Apps
- Social Media Platforms
- Cloud Services
- Financial Systems
The challenge isn’t collecting data—it’s making sense of it.
Power BI solves this problem by transforming large datasets into actionable insights that help organizations:
✔ Increase revenue
✔ Reduce operational costs
✔ Improve customer experiences
✔ Track KPIs effectively
✔ Make data-driven decisions
Because of its ease of use and powerful capabilities, Power BI is now widely adopted across finance, healthcare, retail, manufacturing, logistics, and technology industries.
The Power BI Ecosystem Explained
Power BI is not just a single tool. It is a complete analytics ecosystem.
Power BI Desktop
The development environment where users:
- Build reports
- Create dashboards
- Design data models
- Write DAX formulas
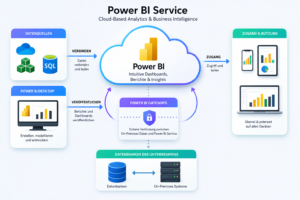
Power BI Service
A cloud platform used for:
- Publishing reports
- Sharing dashboards
- Collaboration
- Governance
Power BI Mobile
Provides access to dashboards and reports on mobile devices.
Power BI Gateway
Enables secure connectivity between on-premises systems and cloud services.
Key Features That Make Power BI Powerful
1. Interactive Visualizations
Power BI offers a wide range of visual elements:
- Bar Charts
- Pie Charts
- Line Graphs
- KPI Cards
- Maps
- Gauges
- Heat Maps
- Custom Visuals
Users can interact with reports using filters, slicers, and drill-down functionality.
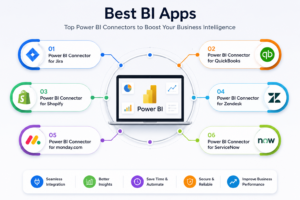
2. Data Connectivity
One of Power BI’s biggest strengths is its ability to connect with hundreds of data sources.
Popular integrations include:
- SQL Server
- Azure SQL Database
- Oracle
- PostgreSQL
- MySQL
- Excel
- SharePoint
- Salesforce
- SAP
- Azure Data Lake
- Snowflake
This flexibility makes Power BI suitable for organizations of all sizes.
3. Power Query for Data Preparation
Before analysis, data often needs cleaning and transformation.
Power Query allows users to:
- Remove duplicates
- Handle missing values
- Merge datasets
- Split columns
- Apply transformations
without writing complex code.
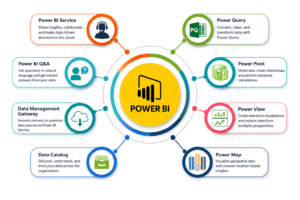
4. DAX for Advanced Analytics
DAX (Data Analysis Expressions) is Power BI’s analytical language.
With DAX, users can create:
- Business KPIs
- Profitability Metrics
- Time Intelligence Calculations
- Ranking Logic
- Forecasting Models
Examples include:
- Year-over-Year Growth
- Running Totals
- Moving Averages
- Dynamic Rankings
5. AI-Powered Analytics
Power BI now integrates Artificial Intelligence features that help users discover hidden insights automatically.
Capabilities include:
- Smart Narratives
- Forecasting
- Key Influencers
- Anomaly Detection
- AI Visuals
- Copilot Assistance
This allows even non-technical users to perform sophisticated analytics.
Essential Tools Covered in a Power BI Course
A comprehensive Power BI training program should cover more than just report creation.
SQL
Used for extracting and querying data from relational databases.
Excel
Still one of the most common data sources used in analytics projects.
Power Query
Used for ETL and data transformation.
Data Modeling
Helps organize data efficiently using:
- Fact Tables
- Dimension Tables
- Star Schema
DAX
Used for advanced calculations and business logic.
Power BI Service
For publishing and managing enterprise reports.
AI & Copilot
For next-generation analytics and productivity.
Real-World Applications of Power BI
Organizations use Power BI across multiple business functions.
Sales Analytics
Track:
- Revenue
- Sales Trends
- Regional Performance
Finance Analytics
Monitor:
- Profitability
- Expenses
- Budget Variance
HR Analytics
Analyze:
- Employee Performance
- Attrition Rates
- Hiring Trends
Healthcare Analytics
Measure:
- Patient Outcomes
- Resource Utilization
- Operational Efficiency
Supply Chain Analytics
Track:
- Inventory Levels
- Vendor Performance
- Logistics Operations
Advantages of Learning Power BI
Easy Learning Curve
Power BI is beginner-friendly and requires minimal programming knowledge.
High Market Demand
Thousands of organizations are actively hiring Power BI professionals.
Cost-Effective Solution
Power BI offers enterprise-grade capabilities at a relatively low cost.
Strong Microsoft Integration
Works seamlessly with:
- Azure
- Excel
- SQL Server
- Microsoft Fabric
- Teams
Excellent Career Opportunities
Power BI skills are valuable across multiple industries.
Career Paths After Learning Power BI
Power BI expertise can lead to roles such as:
Data Analyst
Analyze and visualize business data.
Business Analyst
Bridge the gap between business requirements and technical solutions.
BI Developer
Build dashboards, reports, and analytical solutions.
Reporting Analyst
Develop automated reporting systems.
Analytics Consultant
Help organizations implement data-driven strategies.
Power BI Developer
Specialize in advanced reporting and dashboard development.
Who Should Learn Power BI?
Power BI is suitable for:
- Fresh Graduates
- Data Analysts
- Business Analysts
- Software Engineers
- Database Administrators
- Project Managers
- Finance Professionals
- Data Engineers
- Reporting Professionals
No matter your background, Power BI can help you become more data-driven.
Frequently Asked Questions (FAQs)
Is Power BI suitable for beginners?
Yes. Power BI is one of the easiest Business Intelligence tools to learn and use.
Do I need programming skills?
No. Basic Power BI development can be performed without programming. However, SQL and DAX skills provide additional advantages.
How long does it take to learn Power BI?
Most learners can become productive within 4–8 weeks with practical training and projects.
Is Power BI still in demand?
Absolutely. Power BI remains one of the most requested skills in Data Analytics and Business Intelligence job roles.
Can Power BI connect to cloud platforms?
Yes. Power BI integrates with cloud services including Azure, AWS, Google Cloud, Snowflake, and Microsoft Fabric.
What certification is recommended?
The widely recognized certification is the PL-300: Microsoft Power BI Data Analyst certification.
Why Choose SQL School for Power BI Training?
At SQL School, learners gain practical, industry-oriented training designed to meet real-world business requirements.
Key Benefits
✅ Live Instructor-Led Sessions
✅ Real-Time Industry Projects
✅ Power Query & DAX Mastery
✅ Dashboard Development Practice
✅ AI & Copilot Integration
✅ Interview Preparation
✅ Resume Building Assistance
✅ Recorded Sessions
✅ Hands-On Assignments
✅ Guidance from Industry Experts with 20+ Years of Experience
Conclusion
Power BI is no longer just a reporting tool—it has become a complete Business Intelligence platform that empowers organizations to make faster, smarter, and more accurate decisions.
As businesses continue investing in analytics, professionals with Power BI expertise will remain in high demand. Whether your goal is to become a Data Analyst, BI Developer, or Analytics Consultant, mastering Power BI can significantly accelerate your career growth.
If you want to build a successful career in Data Analytics and Business Intelligence, learning Power BI is one of the smartest investments you can make today.
Power BI Training Course: https://sqlschool.com/powerbi-training/
#PowerBI #PowerBICourse #PowerBITraining #LearnPowerBI #DataAnalytics #BusinessIntelligence #DataAnalyst #BusinessAnalyst #PowerBIDashboard #DataVisualization #PowerQuery #DAX #PL300 #MicrosoftPowerBI #AnalyticsTraining #ReportingTools #DashboardDesign #BIDeveloper #DataDriven #DataAnalyticsCourse #PowerBIProjects #PowerBICertification #PowerBIWithAI #BusinessIntelligenceTraining #RealtimeProjects #CareerInDataAnalytics #MicrosoftFabric #SQLTraining #SQLSchool #DataCareer
Trainer: Mr. Sai Phanindra
With 20+ Years of
technical expertise exclusively on SQL & Database Technologies, I assure you 100% Practical, Step by Step Classes.
Linkdin Profile: www.linkedin.com/in/saiphanindra/
Contact No: +91 9030040801 or +91 9666440801