
How to Create Pandas DataFrames in Databricks Using Python
Introduction
Python is one of the most popular programming languages for data analysis, data engineering, and machine learning. When working with data in Databricks, the Pandas library allows developers to create, organize, manipulate, and analyze structured data using simple Python commands.
A Pandas DataFrame is a two-dimensional data structure that organizes information into rows and columns. It is useful for exploring datasets, cleaning data, performing calculations, and preparing information for further analysis.
In this tutorial, you will learn how to create Pandas DataFrames in Databricks using Python, work with different data sources, filter records, and understand when to use Pandas or PySpark.
What Is a Pandas DataFrame?
A Pandas DataFrame is a table-like structure containing rows and columns. Each column can hold a different data type, such as integers, strings, floating-point numbers, or dates.
For example, an employee dataset might contain Employee ID, Employee Name, Department, and Salary columns.
Pandas provides the DataFrame() constructor to create a DataFrame from dictionaries, lists, NumPy arrays, and other supported data structures.
Prerequisites for Creating Pandas DataFrames in Databricks
Before getting started, ensure you have:
- Access to a Databricks workspace.
- A Databricks notebook configured with Python.
- An available compute resource attached to the notebook.
- Basic knowledge of Python variables, lists, and dictionaries.
Pandas is included as a standard Python package in Databricks Runtime environments, so it is generally available without a separate installation. Official Databricks documentation
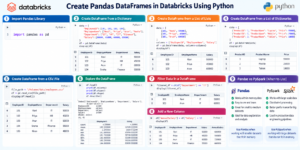
Step 1: Import the Pandas Library
Open your Databricks workspace and create a new Python notebook. Run the following code in a notebook cell.
import pandas as pdHere, pandas is the library name, and pd is its commonly used alias.
You can now use pd.DataFrame() to create and manipulate Pandas DataFrames.
Step 2: Create a Pandas DataFrame Using a Dictionary
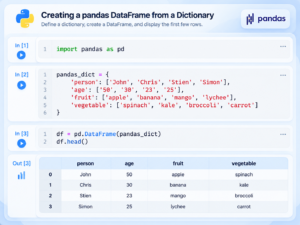
One of the simplest ways to create a DataFrame is by using a Python dictionary. Dictionary keys become column names, and their corresponding lists provide the column values.
import pandas as pd

data = {
    "EmployeeID": [101, 102, 103, 104],
    "EmployeeName": ["Ravi", "Priya", "Arun", "Sneha"],
    "Department": ["IT", "HR", "IT", "Finance"],
    "Salary": [50000, 45000, 60000, 55000]
}

df = pd.DataFrame(data)

display(df)
The output will contain four columns: EmployeeID, EmployeeName, Department, and Salary.
The display() function shows the DataFrame in a table-like format in a Databricks notebook.
Key takeaway: Use a dictionary when you want to define column names explicitly and assign a list of values to each column.
Step 3: Create a Pandas DataFrame Using a List of Lists
You can also create a DataFrame using a list of lists. In this approach, specify the column names separately using the columns parameter.
import pandas as pd

data = [
    [101, "Ravi", 50000],
    [102, "Priya", 45000],
    [103, "Arun", 60000]
]

columns = ["EmployeeID", "EmployeeName", "Salary"]

df = pd.DataFrame(data, columns=columns)

display(df)
Each inner list represents one row in the DataFrame.
Make sure that the number of values in each row matches the number of column names you provide.
Step 4: Create a Pandas DataFrame from a List of Dictionaries
A list of dictionaries is useful when your records are represented as individual objects, particularly when working with API responses or JSON-like data.
import pandas as pd

data = [
    {"ProductID": 1, "ProductName": "Laptop", "Price": 55000},
    {"ProductID": 2, "ProductName": "Mobile", "Price": 25000},
    {"ProductID": 3, "ProductName": "Tablet", "Price": 18000}
]

df = pd.DataFrame(data)

display(df)
Pandas uses the dictionary keys as column names. If a key is missing from a particular record, the corresponding cell will normally contain a missing value.
This method is especially useful when transforming semi-structured data into a tabular format.
Step 5: Create a Pandas DataFrame from a CSV File
In real-world projects, data often comes from CSV files. Pandas provides the read_csv() function to load CSV data into a DataFrame.
import pandas as pd

file_path = "/path/to/your/employees.csv"

df = pd.read_csv(file_path)

display(df)
Replace the example path with the actual location of your CSV file accessible to your Databricks notebook.
After loading the data, you can inspect the first five rows:
df.head()You can also check the number of rows and columns:
print(df.shape)The shape attribute returns a tuple containing the number of rows and columns.
Important: Use a valid workspace, volume, or other supported file path appropriate to your environment. The example path is a placeholder, not a guaranteed Databricks storage location.
Step 6: Explore the Pandas DataFrame
After creating a DataFrame, examine its structure to understand the data before performing transformations.
View the first few rows
df.head()View column names
print(df.columns)Check column data types
print(df.dtypes)Check the number of rows and columns
print(df.shape)Generate summary statistics
df.describe()These commands help you understand the structure, data types, dimensions, and numerical characteristics of a dataset.
Step 7: Filter Data in a Pandas DataFrame
Pandas allows you to filter rows based on conditions.
For example, consider an employee DataFrame containing employee salaries. To retrieve employees whose salary is greater than 50,000, use:
high_salary = df[df["Salary"] > 50000]

display(high_salary)
You can also filter records using multiple conditions.
filtered_df = df[
    (df["Department"] == "IT") &
    (df["Salary"] > 50000)
]

display(filtered_df)
Use parentheses around each condition when combining filters with operators such as & and |.
Filtering is useful for data cleaning, reporting, exploratory data analysis, and preparing datasets for downstream processing.
Step 8: Add a New Column to a Pandas DataFrame
You can create a new column by assigning a value or calculated expression to it.
df["AnnualBonus"] = df["Salary"] * 0.10

display(df)
This example creates an AnnualBonus column equal to 10% of each employee’s salary.
You can also add a constant value to every row:
df["Company"] = "SQL School"

display(df)
These operations are useful when creating derived attributes or enriching datasets during analysis.
Step 9: Convert a Pandas DataFrame to a PySpark DataFrame
Databricks supports both Pandas and PySpark. If you need to process data using Spark’s distributed processing capabilities, you can convert a Pandas DataFrame to a Spark DataFrame.
spark_df = spark.createDataFrame(df)

display(spark_df)
Here, spark.createDataFrame() converts the local Pandas DataFrame into a Spark DataFrame.
Remember that the original Pandas DataFrame is generally processed on a single machine, whereas a Spark DataFrame can use distributed computation across Spark workers.
For large datasets, create or load the data directly into Spark whenever possible instead of collecting large amounts of data into Pandas.
Pandas vs. PySpark DataFrames in Databricks
Pandas and PySpark serve related but different purposes.
| Feature | Pandas DataFrame | PySpark DataFrame |
|---|---|---|
| Processing | Primarily local, in-memory processing | Distributed processing using Spark |
| Best suited for | Small and manageable datasets | Large datasets |
| Main API | pd.DataFrame() | spark.createDataFrame() |
| Common use cases | Data analysis, prototyping, visualization | Data engineering, ETL, large-scale transformations |
| Memory considerations | Data must fit within available local memory | Data can be processed across cluster resources |
Choose the tool based on dataset size, memory constraints, and processing requirements.
Databricks also provides the Pandas API on Spark, which offers familiar Pandas-style operations backed by Spark. It can be useful when working with larger datasets while retaining a Pandas-like programming interface.
Common Mistakes to Avoid
When creating Pandas DataFrames in Databricks, keep these points in mind:
- Mismatched column lengths: Lists used as columns in a dictionary-based DataFrame must have compatible lengths.
- Incorrect file paths: Verify that the CSV file is accessible from your notebook’s compute environment.
- Large datasets: Avoid loading datasets into Pandas if they exceed available memory.
- Incorrect data types: Check whether numeric, date, and text columns have been interpreted correctly.
- Confusing Pandas and Spark DataFrames: They use different APIs and have different execution and memory characteristics.
Following these practices can help you write more reliable Python data processing code.
Real-World Applications of Pandas DataFrames in Databricks
Pandas DataFrames can support several data-related tasks, including:
- Exploring sales, customer, and financial datasets.
- Cleaning small datasets before analysis.
- Preparing data for charts and visualizations.
- Analyzing sample data during ETL development.
- Prototyping machine learning workflows.
- Inspecting a small result set collected from Spark.
For enterprise-scale data engineering, combine Pandas with Spark appropriately to balance ease of use and scalability.
Frequently Asked Questions (FAQs)
1. What is a Pandas DataFrame in Databricks?
A Pandas DataFrame is a two-dimensional, tabular data structure used to store and manipulate data using Python in a Databricks notebook.
2. How do I create a Pandas DataFrame in Databricks?
Import Pandas using import pandas as pd, create your data, and pass it to pd.DataFrame().
3. Is Pandas preinstalled in Databricks?
Pandas is included in Databricks Runtime as a standard Python package, although availability can depend on your environment and configuration.
4. Can I create a Pandas DataFrame from a CSV file?
Yes. Use pd.read_csv("file_path.csv") with a valid path to load CSV data into a Pandas DataFrame.
5. What is the difference between Pandas and PySpark DataFrames?
Pandas primarily processes data locally in memory, while PySpark DataFrames support distributed processing across Spark resources.
Conclusion
Creating Pandas DataFrames in Databricks using Python is a fundamental skill for Data Analysts, Python developers, and Data Engineers. You can create DataFrames from dictionaries and lists, import CSV files, inspect data, filter records, add calculated columns, and convert suitable datasets to PySpark DataFrames.
The most important consideration is selecting the right DataFrame technology for your workload. Use Pandas for local analysis and manageable datasets, and use PySpark or the Pandas API on Spark when your workflow requires scalable processing.
With regular practice, you can apply these techniques to data analysis, ETL development, and Databricks-based data engineering projects.
Learn Data Engineering with SQL School
Want to develop practical skills in Python, Databricks, Azure Data Engineering, and Microsoft Fabric?
SQL School Training Institute offers practical, interactive training designed to help learners build technical skills through exercises and real-world project scenarios.
Explore the available courses at SQL School and take the next step in your Data Engineering learning journey.
Contact SQL School: +91 9666440801 | +91 9951440801
#Databricks #Python #Pandas #PandasDataFrame #DataEngineering #AzureDatabricks #PythonProgramming #DataAnalytics #PySpark #BigData #DataScience #DatabricksTutorial #PythonTutorial #DataManipulation #SQLSchool