PL – 300 is the Microsoft certification for the Data Analyst. Data Analyst is a promising job role that deals with Data, Analysis, Derived Information and drive to Infographics of enterprise content. This role also involves Data collection, data processing, and data analysis to identify trends, patterns, and relationships that can be used to solve problems and make informed decisions with ease!
✅ Power BI Desktop & Service
✅ Data Modeling, DAX Functions
✅ Power Query (M), Parameters
✅ Interactive Dashboards, Apps
✅ Big Data Access, DAX
✅ Dynamic Row Level Security (RLS)
✅ Power BI with Azure & Fabric
✅ Power BI Deployment, IAM
✅ End-to-End Real-Time BI Project
✅ 1:1 Mentorship, Interview Guidance
Module 1: Power BI
Ch 1: Power BI Intro, Installation
- Power BI & Data Analysis
- 5 Design Tools, 3 Techniques
- 2 Hosting Solutions
- Power BI with Co-Pilot & AI
- Power BI Installation
Ch 2: Report Design Concepts
- Basic Report Design (PBIX)
- Get Data, Canvas (Design)
- Data View, Data Models
- Data Points, Spotlight
- Focus Mode, PDF Exports
Ch 3: Visual Interactions, PBIT
- Visual Interactions & Edits
- Limitations with Visual Edits
- Creating Power BI Templates
- CSV Exports & PBIT Imports
Ch 4: Grouping, Hierarchies
- Creating Groups : Lists
- Creating Groups: Bins
- List Items & Group Edits
- Bin Size & Bin Count
Ch 5: Slicer & Visual Sync
- Slicer Visual in Power BI
- Slicer: Format Options
- Single Select, Multi Select
- Slicer: Select All On / Off
- Visual Sync with Slicers
Ch 6: Hierarchies & Drill-Down
- Hierarchies: Creation, Use
- Hierarchies: Advantages
- Drill Up, Drill Down
- Conditional Drill Down
- Filtered Drill Down, Table View
Ch 7: Filters & Drill Thru
- Power BI Filters
- Basic, Top & Advanced
- Visual Filters, Page Filters
- Report Level Filters, Clear Filter
- Drill Thru Filters & Usage
Ch 8: Bookmarks, Buttons
- Power BI Bookmarks
- Images: Actions, Bookmarks
- Buttons: Actions, Bookmarks
- Page to Page NavigationsScore Cards, Master Pages
Ch 9: SQL DB Access & Big Data
- SQL DB Access, Queries
- Storage Modes: Direct Query
- Formatting & Date Time
- Storage Modes in Power BI
- Azure (Big Data) Access & Formatting
Ch 10: Power BI Visualizations
- Charts, Bars, Lines, Area
- TreeMaps & HeatMaps
- Funnel, Card, Multrow Card
- PieCharts & Waterfall
- Scatter Chart, Play Axis
- Infographics, Classifications
Ch 11: Power Query Introduction
- Power Query (Mashup)
- ETL Transformations in PBI
- Power Query Expressions
- Table Combine Options
- Merge, Union All Options
- Close, Apply & Visualize
Ch 12: Power Query : Table Tfns
- Table Duplicate, Header Promotion
- Group By Transformation
- Aggregate, Pivot Operation
- Reverse Rows, Count Rows
- Advanced Power Query Mode
Ch 13: Power Query: Column Tfn
- Any Column Transformations
- Data Type Detection, Change
- Rename, Replace, Move
- Fill Up, Fil Down
- Step Edits & Rollbacks
Ch 14: Power Query: Text, Date
- String / Text Transformations
- Split, Merge, Extract, Format
- Numeric and Date Time
- Add Column & Expressions
- Expressions and New Columns
- Column From Examples
Ch 15: Power Query: Parameters
- Parameters in Power Query
- Static Parameters, Defaults
- Dynamic Dropdowns, Lists
- Linking with Table Queries
- Step Edits, Type Conversions
Ch 16: Power BI Cloud: Publish
- Power BI Cloud Concepts
- Workspace Creation, Usage
- Report Publish Cloud
- Report Edits in Cloud
- Semantic Models & Usage
Ch 17: Power BI Cloud Dashboards
- Power BI Dashboards
- Dashboard Creation, Usage
- Pin Visuals, Pin LIVE Pages
- Add Image, Video Tiles
- Q&A & Pin Tiles
Ch 18: Power BI Cloud Operations
- Report Shares, Alerts
- Subscriptions, Exploration
- Downloads & Edits
- Report Cloning in Cloud
- QR Codes, Web Publish
- Lineage & Metrics
Ch 19: Power BI Cloud Gateways
- Data Gateways, Data Refresh
- Install, Configure Gateways
- Data Sources Configurations
- Data Refresh & Scheduling
- Gateway Optimizations
Ch 20: Power BI Cloud Apps
- Power BI Apps: Creation
- App Sections & Content
- Audience Options
- App Security & Sharing
- App Updates, Favourites
- App URL, End User Access
Ch 21: Power BI Report Server
- SQL Server 2025 (Mandatory Installations)
- Power BI Report Server
- Report Server Vs Cloud
- Installation, Configuration
- RS Config Tool Options
- Report Database, TempDB
- Web Service & Server URL
Ch 22: Paginated Reports
- Report Builder Tool
- Paginated Report (RDL)
- Report Expressions (RDL)
- Tablix, Chart Wizards
- Fields & Drill-Down
- RDL Report Publish
Ch 23: DAX Concepts (Basics)
- DAX Concepts: Intro & Realtime Need
- DAX Columns: Creation, Use
- DAX Measures: Creation, Use
- DAX Functions: IIF, ISBLANK
- SUM, CALCULATE Functions
- DAX Cheat Sheet
Ch 24: DAX Quick Measures
- Quick Measures in Power BI
- Average & Filters
- Running Totals
- Star Rating Calculations
- DAX Measures in Data View
- DAX in Visuals
- DAX in Cloud Reports
Ch 25: Data Modelling, DAX
- Dimensions Tables
- Fact Tables & DAX Measures
- Data Models & Relations
- DAX Expressions
- Star & Snowflake Schemas
- DAX Joins & Expressions
Ch 26: DAX Joins, Variables
- CALCULATEX & Variables
- COUNT, COUNTA, etc..
- SUM, SUMX, etc..
- SELECTED MEMEBER
- Filter Context, RETRUN
- Dynamic Report with DAX
Ch 27: DAX Time Intelligence
- Need for Time Intelligence
- Date Table Generation
- Time Intelligence with DAX
- PARALLELPERIOD, DATE
- CALENDAR, Total Functions
- YTD, QTD, MTD with DAX
Ch 28: DAX – Row Level Security
- RLS: Row Level Security
- Data Modelling & Roles
- Verify Roles (Testing)
- Add Cloud Users to Roles
- Dynamic Row Level Security
- Testing RLS in Power BI
Ch 29: Analytical Reports
- Analytical Report Concepts
- Excel Data Analytics
- Excel with Power BI Cloud
- SQL, AVRO, JSON Sources
- Analyse in Excel (Cloud)
- Excel Reports to Cloud
Module 2: AI & CoPilot, PL 300
Ch 30: Power BI AI, CoPilot
- AI Components in Power BI
- CoPilot Practical Uses
- CoPilot with Desktop
- CoPilot with Cloud
- Need for AI Analytics (Fabric)
- PL 300 Exam (Microsoft Certified Data Analyst) Guidance
- PL 300 Exam Mocks
Ch 31: Fabric Concepts
- Fabric Introduction
- Fabric Lakehouse
- Fabric Warehouse
- Fabric Stream House
- Data Loads & Imports
Ch 32: Fabric Data Models
- Fabric Semantic Models
- Fabric Layouts
- Report Design
- Power BI Dashboards
- Data Exploration
- Apps & Publish
Module 3: PL300 Exam Guidance
- PL 300 Exam (Microsoft Certified Data Analyst) Guidance
- PL 300 Exam Mock Exams
- PL 300 Exam Samples (Dumps)
Module 4: Realtime Project
- Realtime Project 1 (ECommerce / Financial Analysis)
- Realtime Project 2 (Health Care / Banking)

What is the Power BI Training course?
This course covers SQL Server TSQL, Power BI Desktop, Power BI Cloud, Report Server, Power Query, DAX, Data Modelling, Dashboards, AI & CoPilot, and a real-time end-to-end project.
Who should join this Power BI training?
Data Analysts, Business Analysts, SQL Developers, BI Developers, Reporting Analysts, and professionals who want to build a strong data analytics career.
What are the modules included in this program?
The course is carefully curated with below module:
Module 1: MSSQL & TSQL (3 weeks, 3 real-time case studies)
Module 2: Power BI (4 weeks, 1 real-time project)
Module 3: AI & CoPilot (2 weeks, 1 real-time case study)
Do I need prior technical experience to learn Power BI?
No. SQL and Power BI are taught from basics to advanced with step-by-step practical explanations, making it suitable for beginners.
What SQL topics are covered before starting Power BI?
Database fundamentals, commands, joins, functions, stored procedures, triggers, transactions, indexing, views, CTEs, window functions, normalization, remote joins, subqueries, and 3 real-time case studies.
What will I learn in Power BI Desktop?
Report design, data modeling, visualizations, interactions, templates, slicers, drill-downs, filters, bookmarks, buttons, groupings, and exporting reports.
Are advanced visualizations included in the course?
Yes. Bar, line, area, pie, cards, maps, heatmaps, treemaps, waterfall, scatter, infographics, and storytelling visuals are all included.
What Power Query skills will I gain?
Data cleaning, merging tables, unioning data, pivot/unpivot, grouping, transformations, expressions, parameters, dynamic lists, and advanced ETL operations.
Is Data Modelling covered in this training?
Yes. Fact & Dimension tables, star and snowflake schemas, relationships, DAX modeling, and best practices for enterprise-level modeling are taught.
What DAX functions will I learn?
DAX basics, quick measures, aggregations, date/time intelligence (YTD, QTD, MTD), DAX joins, variables, filter context, and row-level security.
Do you teach Row Level Security (RLS)?
Yes. Static and dynamic RLS, role creation, testing, cloud user roles, and complete security implementation are covered.
Does the training include Power BI Cloud (Service)?
Yes. Workspaces, semantic models, dashboards, report publishing, data refresh, gateway configurations, sharing, alerts, subscriptions, lineage, and Power BI Apps.
Is Power BI Report Server included?
Yes. Installation, configuration, RDL report development using Report Builder, SQL queries, paginated reports, publishing, and administration are taught.
Do we learn SQL DB & Big Data access in Power BI?
Yes. Direct Query, big data modeling, Azure access, cloud databases, and enterprise storage modes are included.
Is AI and CoPilot covered in Power BI?
Yes. AI visuals, CoPilot in Desktop, CoPilot in Cloud, CoPilot for Power Query, DAX, and Excel analytics, plus fundamental AI concepts and real-time AI use cases.
Are there real-time projects in this course?
Yes. A complete real-time project with requirement analysis, model design, Power Query implementation, DAX analytics, cloud publishing, and Report Server deployment.
Do you provide PL-300 Certification guidance?
Yes. PL-300 exam pattern, sample questions, mock exam, certification tips, and resume guidance are included.
Is the course suitable for beginners and non-IT learners?
Absolutely. The training starts from fundamentals and progresses to advanced analytics step-by-step.
What job roles can I apply for after completing this course?
Power BI Data Analyst, Business Intelligence Analyst, SQL Analyst, Reporting Analyst, Data Modeler, Power Query Specialist, AI/CoPilot Analyst.
What training modes are available?
Live Online Training, Self-Paced Video Training, Corporate Batches, and Free Demo Sessions with the trainer.
Placement Partners


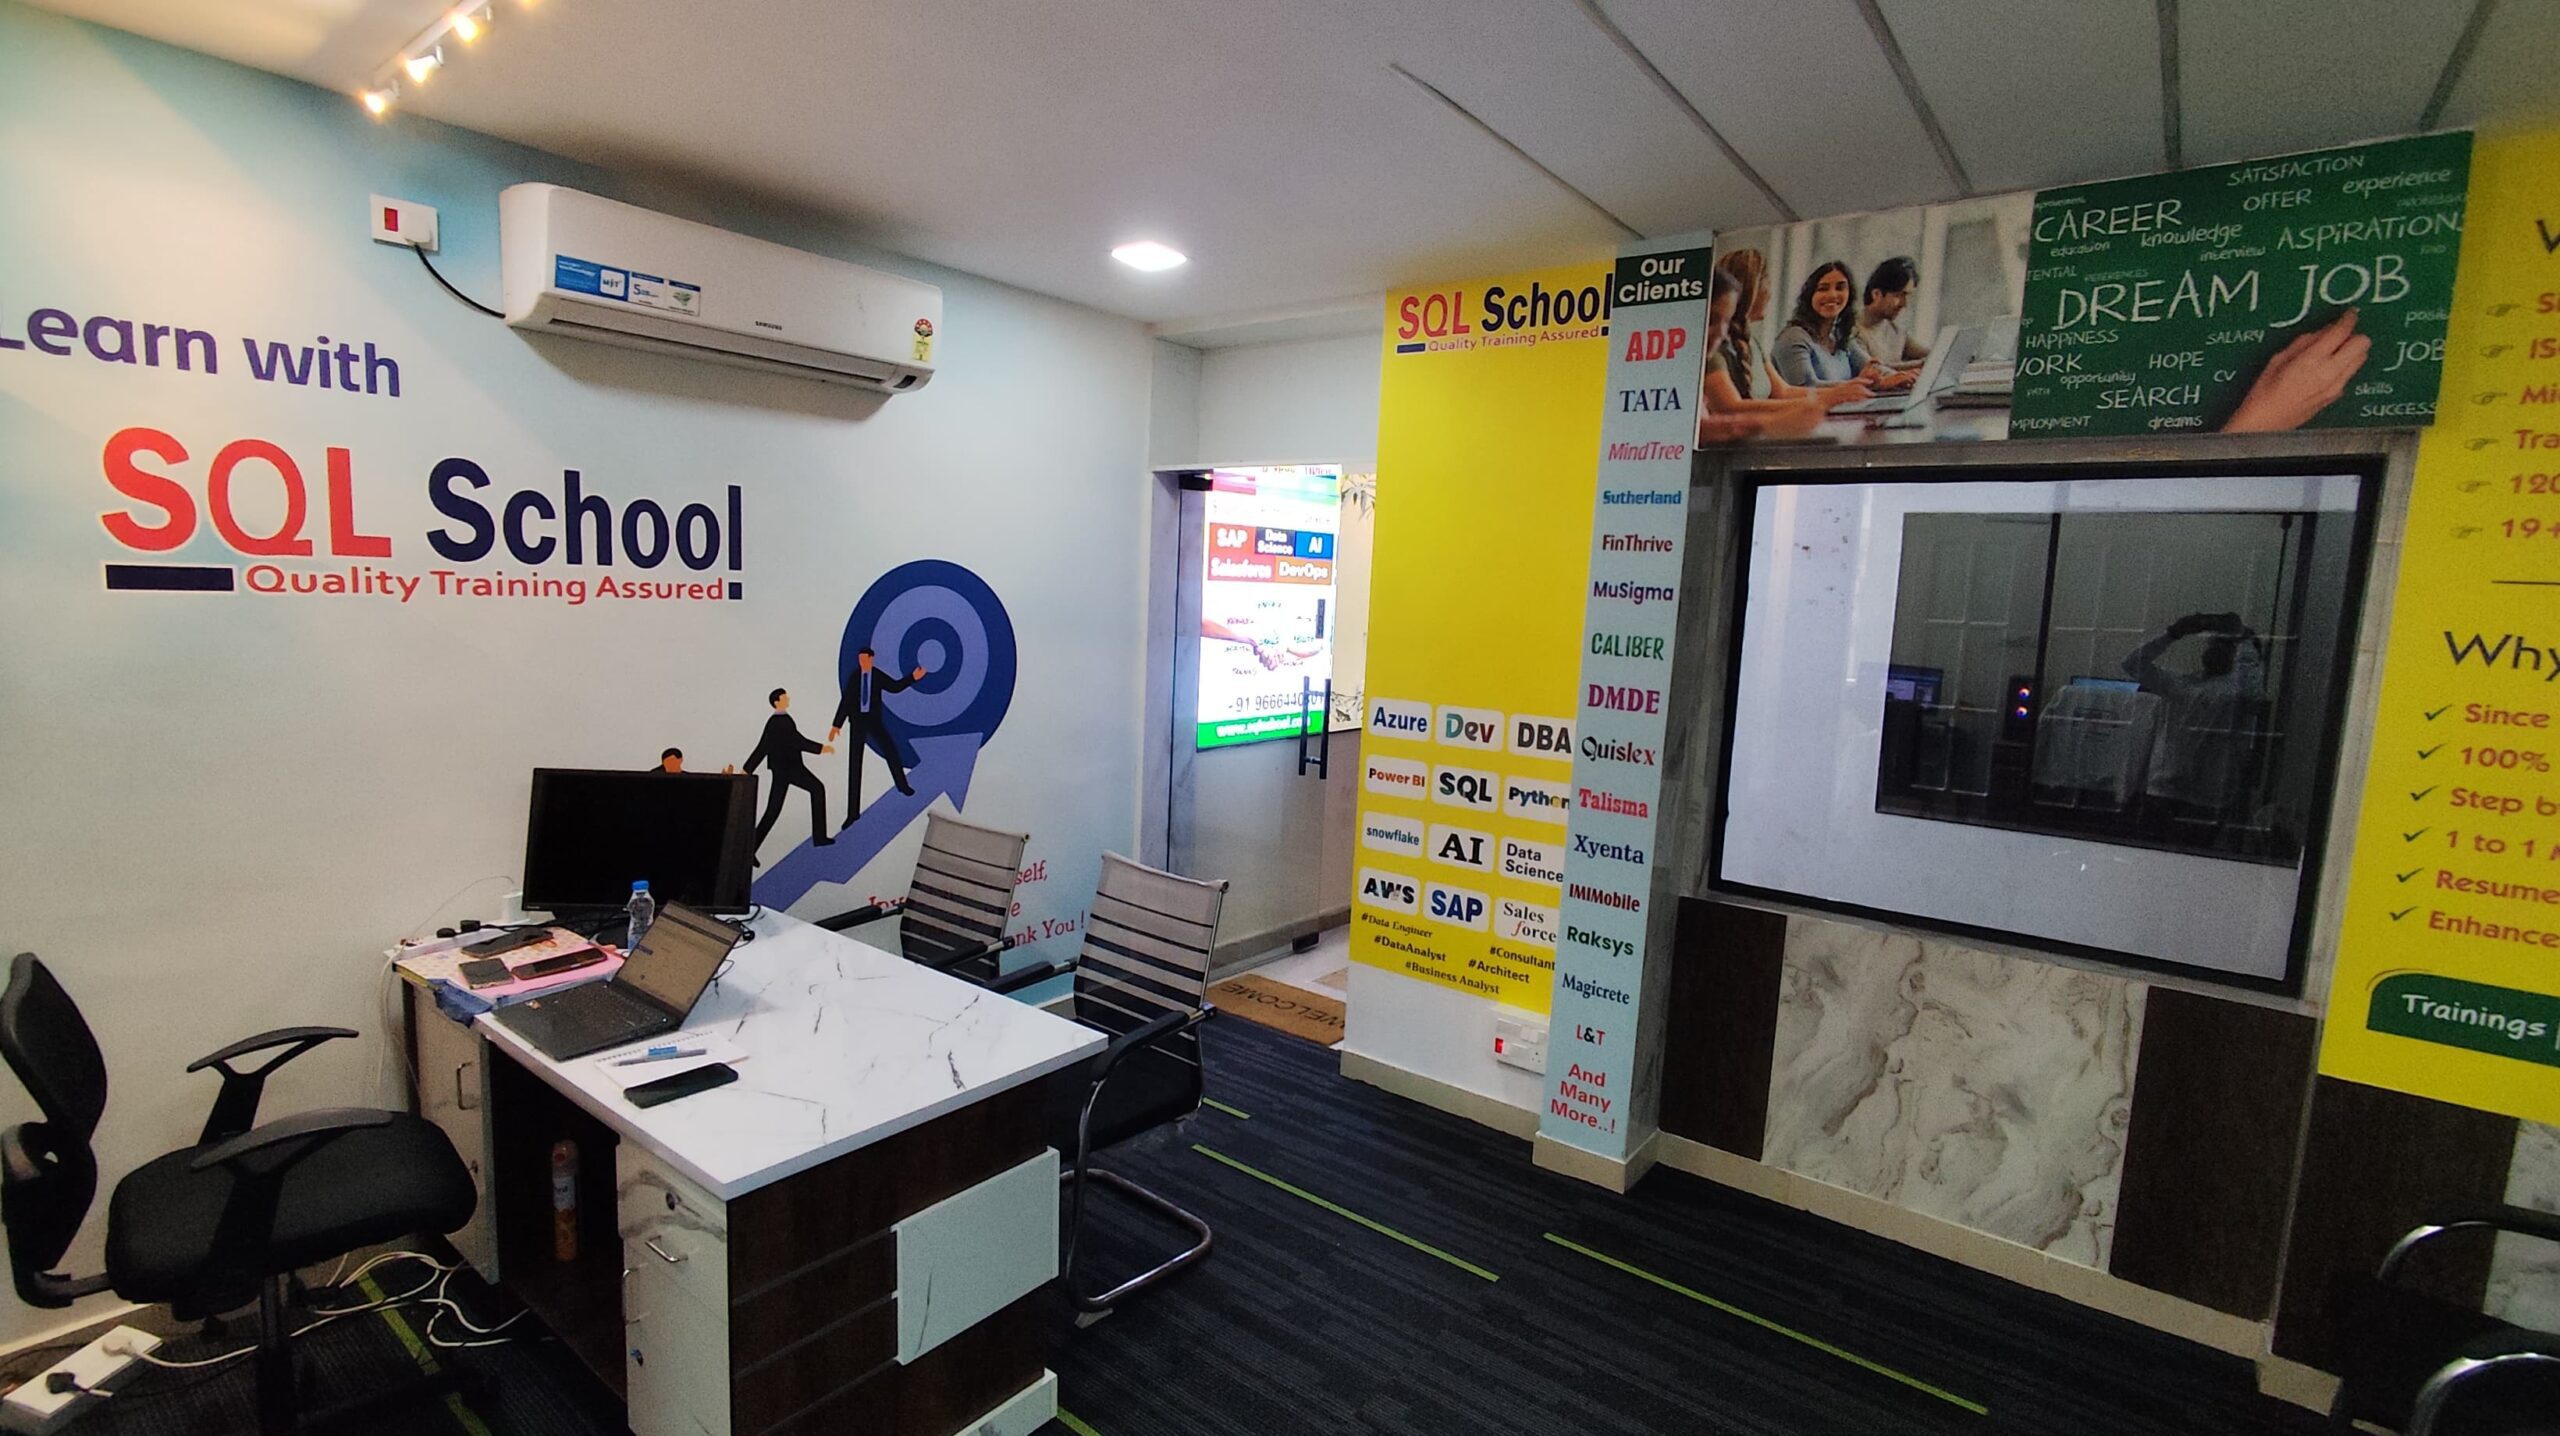
SQL SCHOOL
24x7 LIVE Online Server (Lab) with Real-time Databases.
Course includes ONE Real-time Project.
#Top Technologies


Why Choose SQL School
- 100% Real-Time and Practical
- ISO 9001:2008 Certified
- Weekly Mock Interviews
- 24/7 LIVE Server Access
- Realtime Project FAQs
- Course Completion Certificate
- Placement Assistance
- Job Support